Hurricane Season May Update 1 year ago
May 5, 2024
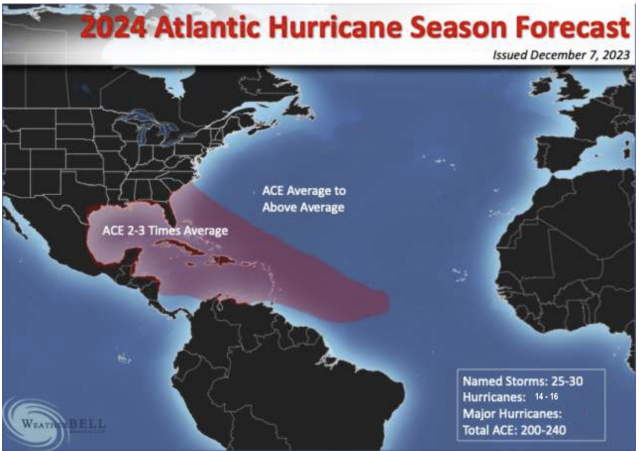
- There are no changes to the Hurricane forecast we have had out since December.
- You are seeing people come toward this forecast.
Basin Forecast
Names Storms 25-30
Hurricanes 14-16
Major Hurricanes 6-8
Total ACE 200-240
Note that this comes out to an average ACE per storm of 8.
Impact Forecast
Named storm Impacts 10-14
Hurricane Impacts 5-8
Major Hurricane Impacts 3-5
There is no reason to change the forecast as the latest Euro continues to back us up. You are not going to cool appreciably the Main Development Region in the Atlantic. The combination of all the warm water around Africa and the eastern Atlantic means an upward motion machine will develop during the hurricane season, right in the prime correlation areas of MJO Phases 2 & 3. Remember, it's not the center of the upward motion areas, it's to the west of it where you look, as that is where the convergence is greatest between the net sinking to the west (and higher pressure and the lower pressure) that gets spit out from the east.
One thing we look at is the Indian Monsoon. The 6 highest impact seasons on the U.S. coast since 1995 have produced this rainfall in India from June to August:

Here is the latest from the monsoon forecasters:

Phases 2 & 3 of the MJO:

The Euro Seasonal:

There's the ridge over troubled waters pattern:

Sea Level Pressure:

The mean of the big seasons' Sea Level Pressure:

The Euro's ACE forecast is now two times the average, right where we had it in our December outlook:

Notice the western Pac is 60% of the average, another idea we have had.
Here comes the Euro May idea. Who gets it worst is in the red zones and is very close to ours:

Notice the below normal ACE in the western Pacific:

Since the western Pac is normally three times the Atlantic, the implications are for an ACE total that balances the Atlantic (if we are thinking globally). There is more. The forecasted difference in Nino3.4 (a La Niña in the Pacific) and the SSTs in the Atlantic would be the greatest on record.
In addition, I like to look at the forecasted 200-850 mb pattern. The area between the red to the north (which would suggest a tighter westerly jet) and the blue to the south (with the easterly jet) would put the area in between the two in the prime correlation area for development.

The forecast now is like 2020, but on steroids:

The Verdict
I think our ideas are evolving according to plan. There is no way I will be able to get this big of a jump every year, but this year was a special case. It has not been verified yet, but you can see that sometimes the research we have done here at WeatherBELL can pay off to get you a jump on what everyone else is now saying.
I say that because everyone seems to be seeing what we are, but several months later. I don't think we have the potential for the kind of misfire that happened this past winter (I have explained that). What could happen is a big hurricane season like 2010, but not a lot of hits. However, that year there was major rainfall over the northern Gulf of Mexico early on and it cooled the water. In fact, in August of that year, my father asked me if I was concerned about that because he thought it was taking some of the juice out of that area. There is nothing like older eyes as he was right. We are not seeing that this year and the upside potential is the greatest I can remember.