Updated Hurricane Forecast 3 months ago
September 3, 2024
- Mid and late season should be active, perhaps hyperactive.
- The impact threat is still high.
Totals for the 2024 Atlantic Basin Season
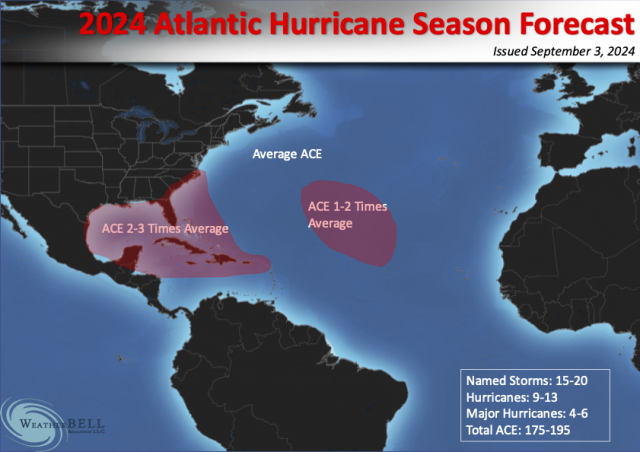
Named storms: 15-20
Hurricanes: 9-13
Major hurricanes: 4-7
Total ACE: 175-195
U.S. Impacts Forecast Totals
Named Storm Impacts: 8-10
Hurricane Impacts: 4-6
Major Hurricane Impacts: 2-3
* Impacts are determined based on warnings issued and verifications
Discussion of the Season So Far
The storms that have developed have been our red zone, and it's where 90% of the ACE has been.
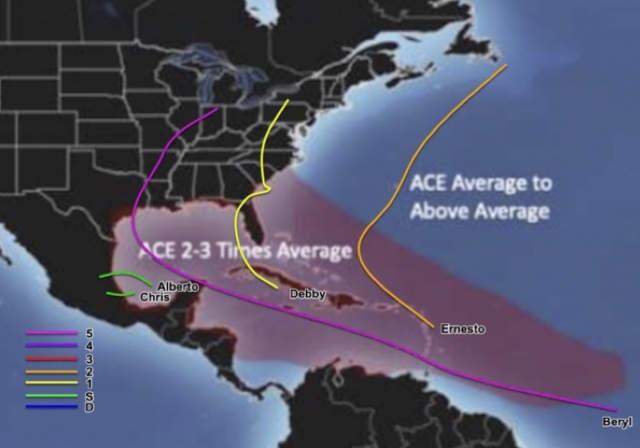
However, there clearly have not been as many as I thought we'd have by this time. Still, since I joined in 2011, WeatherBELL has pioneered a forecast on where the storms will go, which is beyond what anyone else does. That looks to have merit so far. To date, the season has had 5 storms with 4 named storm impacts in the U.S. and two hurricane impacts. Remember, Alberto had warnings up for South Texas and Debbie made landfall as a hurricane in Florida and a tropical storm in the Carolinas. Of course, there was also Beryl.
Since Ernesto, the MJO vertical velocity patterns have moved into phases that are majorly detrimental to tropical cyclone production. The season got off to the start anticipated. When Ernesto was done, the ACE was 4 times average. Of course, ACE has flatlined since then, and you can see why by looking at the MJO. Over the past two weeks, major sinking has developed over the Western Hemisphere.
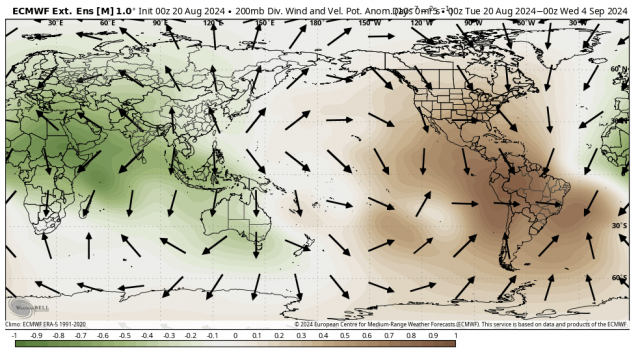
It will continue for the next two weeks:
.png)
It is more or less going to be a push for the following two weeks, which should allow above-average activity to develop given the favorable Main Development Region/ENSO couplet.
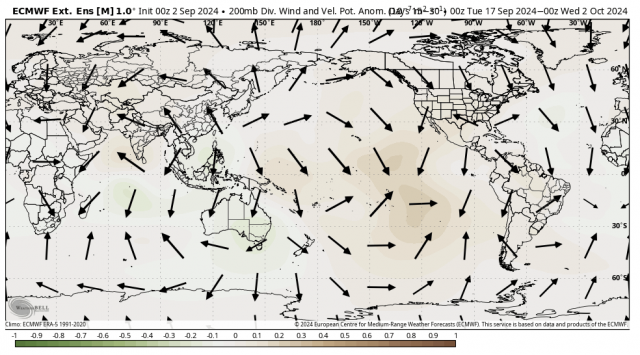
Then it should turn very favorable late in the month and for October.
.png)
The bust on my part was assuming the JMA forecast for the season would be sustained.
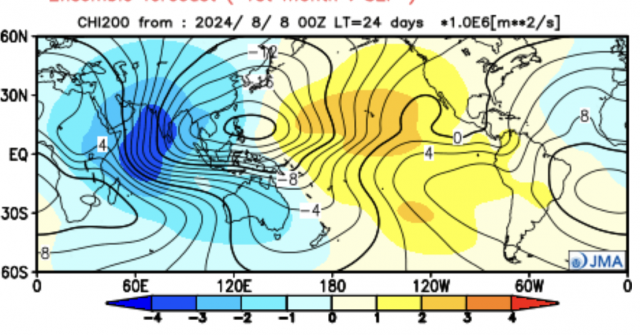
The JMA will forecast will likely be accurate from mid-September onward, but the first two weeks will not look like this.
That being said, we will likely see development in the Gulf of Mexico before September 11 (the midpoint of the season), and from then on we should be normal to above normal, with the threat of multiple storms at once and dual-impact threats on the coast.
Part of this is because of global temperature distortion that occurs when warming over land competes with the Tropics. We see this now. With Asia having so much upward motion, there has to be compensating sinking elsewhere. As Asia and the northern oceans cool, there should be a feeding frenzy for a time in the Atlantic. It's a great experiment because if there is not, then it means that solar activity is leftover as the other variable that would win the day.
The heating at the height of Northern Hemisphere temperatures is likely helping. This is part and parcel of my ideas that the overall warming of the globe is impacting the Global Wind Oscillation, vertical velocities, and sea level pressure patterns.
I do not really care about numbers, but the reason for the initial forecast for 25-30 was threefold:
- 5 are automatically added due to the naming of ham sandwiches (storms that spin up with less than 2 total ACE, which would not have been seen prior to our modern observation network).
- Another 5 were added to what I consider the recent average (now 15-20). If your base is 15-20, and you add the ham sandwiches and the above normal idea you get 25-30.
- I also thought with less activity than average in the Pacific, the Atlantic would have to take up the slack to some degree. I still think it will.
What is the cause of this? Quite frankly, I did not pay attention to my own long-standing climate ideas on distorted heat. The water is so warm so far north, so there is no focus.
.png)
The Western Pacific is suffering from the same problem. That being said, even with those anomalies, the Main Development Region seasonally warms more over the next month and the northern oceans cool, so even if anomalies remain, the actual SSTs should be able to set this off. When the cap comes off, it may turn into a real track race, which has to be taken into account.
High solar activity is also playing a role in this, but the research on that has been inconclusive. The reason is that it seems like when solar activity is increasing, impact occurs on the Tropics, and it's increasing now. 2013 was very unusual in that there is usually an El Niño trying to develop in those situations.
.png)
This time we went past it so I used the analogs of the bounce off the El Niño to La Nada or La Niña. There was that relationship again (in 2013) between warmer North Atlantic water and the Main Development Region. Again we are in a much warmer situation now, so while 2013 has to be considered it's hard to say that high solar activity was the main contributor.
The other solar peaks had El Niños going off, so who is to say whether that is the case? It may be that the trend and the reaction of the atmosphere to the trend plays a role.
Discussion of the Season Going Forward
Rest of the season Atlantic Basin Forecast
Named storms: 10-15
Hurricanes: 6-10
Major Hurricanes: 3-5
Additional ACE: 120-140
Rest of the Season U.S. Impact Forecast
Names Storm Impacts: 4-6
Hurricane Impacts: 3-4
Major Hurricane Impacts 2-3
It is very fortunate for the forecast that at the height of the season, the MJO Vertical Velocity patterns are about to do what they are going to do. It may turn out to be a "bookends" season where there is above to well above average activity from mid-September into early November. Remember that because the oceans lag, we see some seasonal distortion of temperatures, not only in the U.S. but in the oceans. With the La Niña likely to strengthen a bit more and some of the other caps coming off, we may see the season click into high gear in the second half.
While this has not been a hurricane season from hell so far, I believe the most active part of the season is yet to come. The MJO is important, as we can see how systems have struggled since Ernesto. All storms so far have developed in Phases 8, 1, 2, and 3, and it looks like the Euro vertical velocity pattern will reorganize there again.
One more thing: if we look at the years when the season after September 15 had above-average impacts on U.S. coasts, there is a remarkable correlation to a cold start to winter. We saw this three years ago with Ian and Nicole. Interestingly enough, the Euro 46-day precipitation forecast looks similar to what it was seeing for that tandem in 2022.
.png)
The Euro's sea level pressure looks similar to 2022 as well.
.png)
The corresponding analog years for December:
.png)
The rest of the winters then wound up warm overall, similar to the Euro look right now for the upcoming winter.
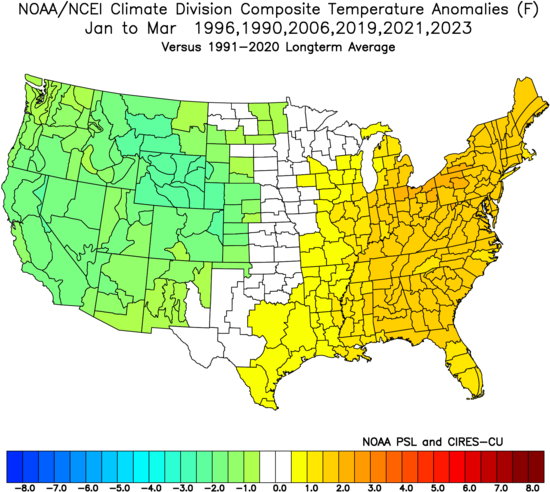
The reason for the cold start may be that the same MJO phases that produce storms also are notable for cold air in winter. So a 40-60 day rotation from a global pattern that is producing later storms would target the early winter for cold snaps. That is just a side feature.
It's interesting to note the CFSv2 has cooled dramatically in the last 10 days for December.
The CFSv2 ten days ago:
.png)
The CFSv2 now:
.png)
This is the coldest December forecast on the CFSv2 in 10 years.